Connect Claude to Power BI with MCP
Apr 8 2026 · 11 min read · #power-bi #claude #mcp #dax #fabric #semantic-model
By Aaron Foong, AI & Data Solutions Engineer at AGOS Asia
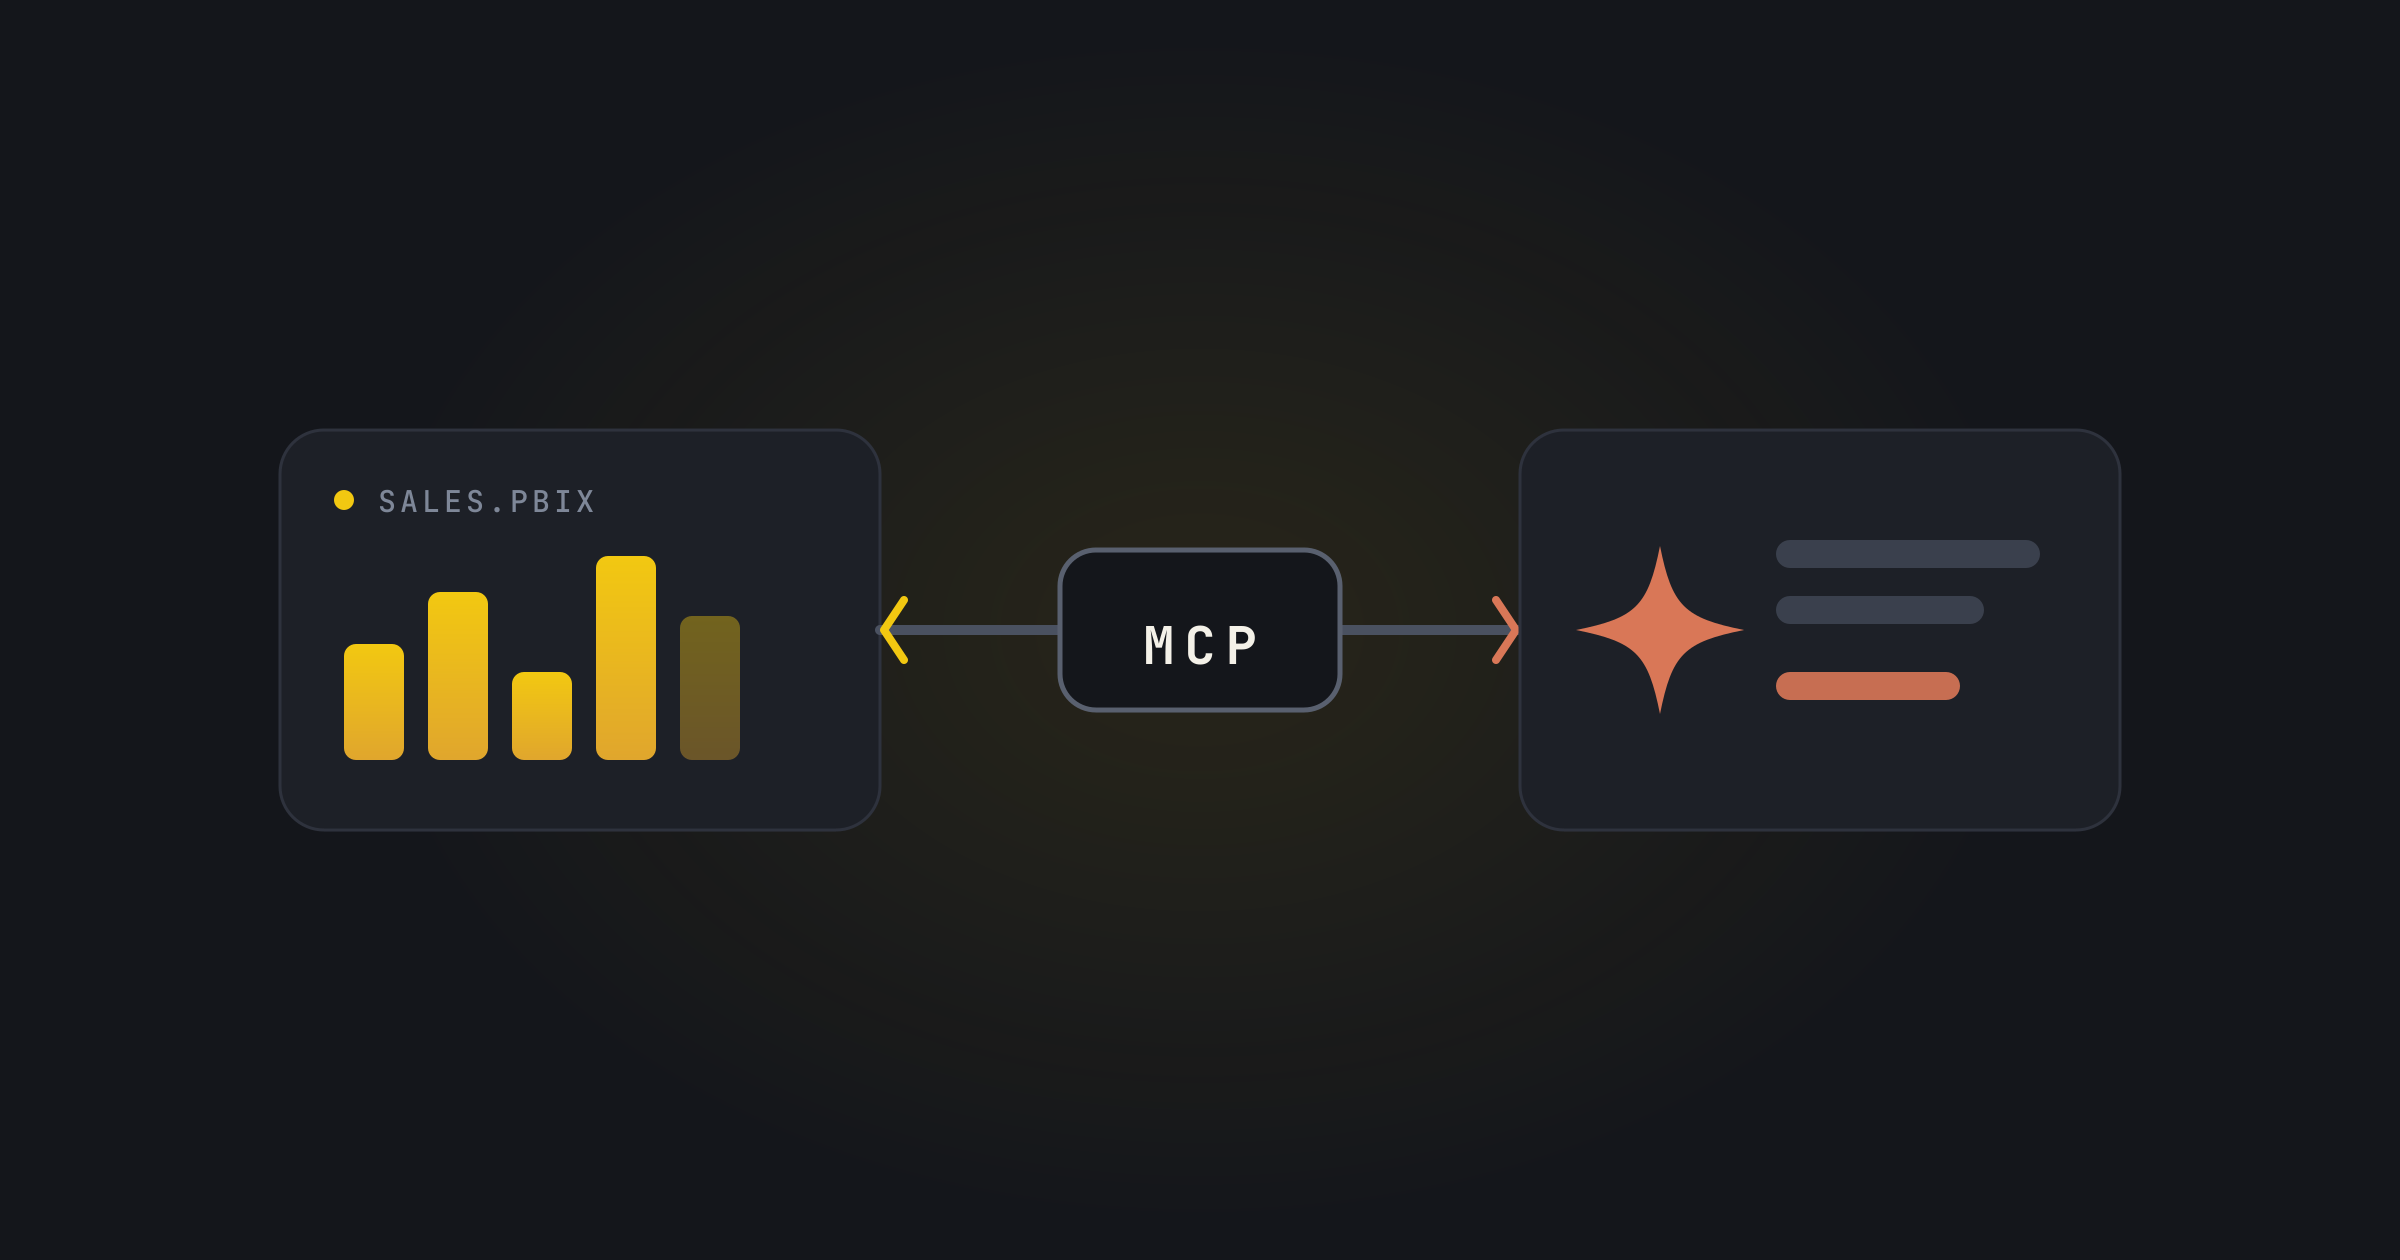
You can connect Claude straight into a live Power BI semantic model. Microsoft put out a local MCP server, the Power BI Modeling MCP Server, that provides any MCP client (Claude Desktop included) access to the model layer. Tables, columns, measures, relationships, DAX queries. Claude stops being a thing you paste DAX into and starts acting like a junior modeler with its hands on the actual model.
I’ve been running it on client work for a bit now. Here’s what works and what doesn’t.
Last tested July 2026 with Power BI Desktop (June 2026 release), Claude Desktop on Windows, and @microsoft/powerbi-modeling-mcp v0.5.0-beta.11 (public preview). This stuff changes almost monthly, so if you’re reading this a lot later, check the repo for the latest version.
There are two servers with almost the same name
This confuses people constantly, so let’s clear it first. Microsoft ships two Power BI MCP servers. The remote one is a hosted endpoint for asking questions of already-published models; it writes DAX using the same engine behind Copilot in Power BI. The local one, the Modeling MCP, runs on your machine and actually reads and edits models. This article is about the local one, because that’s where the real building happens. Microsoft’s own overview page splits them the same way: remote for insights, local for building.
What it can and can’t do
Once it’s connected, Claude can:
- Attach to a model open in Power BI Desktop, a model published to a Fabric workspace, or the TMDL files inside a Power BI Project (PBIP) folder
- List and read every table, column, measure, relationship, and its Power Query source
- Write, validate, and run DAX queries against the live model
- Create, update, and delete measures, columns, tables, and relationships, one at a time or in bulk with transactions
- Handle the fiddly stuff too: calculation groups, row-level security roles, perspectives, translations, hierarchies, Power Query parameters
- Capture Analysis Services traces to dig into query performance
The one big thing it can’t do is touch the report canvas. No visuals, no pages, no conditional formatting, no themes. That’s a separate layer this server has no tools for, and I’ll cover the ways around it further down.
What you need
Four things:
- Windows, basically. Power BI Desktop is Windows-only, so the Desktop route is too. The server itself does ship macOS and Linux builds, which matters if you’re connecting to a Fabric workspace model or PBIP files instead. More on that in the FAQ.
- A model to work on. Easiest is a
.pbixopen in Power BI Desktop. A Fabric workspace model or a PBIP folder works too. - Claude Desktop. A local MCP server is a process running on your machine, and the claude.ai website can’t launch one. Has to be the desktop app.
- Node.js, which is how you get the server. It bundles npm, and that’s all the install you need.
One extra note for Fabric-hosted models: the workspace has to be on a capacity with the XMLA endpoint set to read-write (a Fabric F SKU, Premium, or Premium Per User). A plain Pro workspace on shared capacity won’t take XMLA writes.
Where to get it
Microsoft publishes the server to npm as @microsoft/powerbi-modeling-mcp. The package is a thin wrapper that pulls down the right binary for your platform, so you don’t pick an architecture or unzip anything.
Two links worth keeping open:
- npm package: npmjs.com/package/@microsoft/powerbi-modeling-mcp
- GitHub repo for the README, tool list, and troubleshooting guide: github.com/microsoft/powerbi-modeling-mcp
Worth knowing before you start: it’s still on beta version tags (0.5.0-beta.x as I write this), which is Microsoft’s way of saying the tools may change over time.
Setting it up, step by step
-
Install Node.js. Grab the Windows installer (.msi) from nodejs.org and click through it. Defaults are fine. This gets you
npm, which is all you’re really after. Check if it works by opening a fresh terminal and running:node --version npm --versionIf both print a version, you’re set. If they don’t, you probably need to close and reopen the terminal so it picks up the new PATH.
-
Install the server. One command:
npm install -g @microsoft/powerbi-modeling-mcpThat pulls down the right binary for your platform and puts a
powerbi-modeling-mcpcommand on your PATH. -
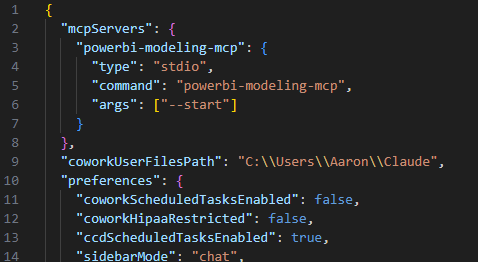
Open Claude’s config. In Claude Desktop go to Settings, then Developer, then Edit Config. That opens
claude_desktop_config.json(on Windows it’s at%APPDATA%\Claude\claude_desktop_config.json). It could be sitting in your Local or Roaming path depending on your setup. -
Add the server. Point Claude at the command you just installed:
 "mcpServers": {
   "powerbi-modeling-mcp": {
	 "type": "stdio",
	 "command": "powerbi-modeling-mcp",
	 "args": ["--start"]
   }
 },
-
Fully restart Claude Desktop. Closing the window isn’t enough. Quit it from the system tray, then reopen. New config only loads on a real restart.
-
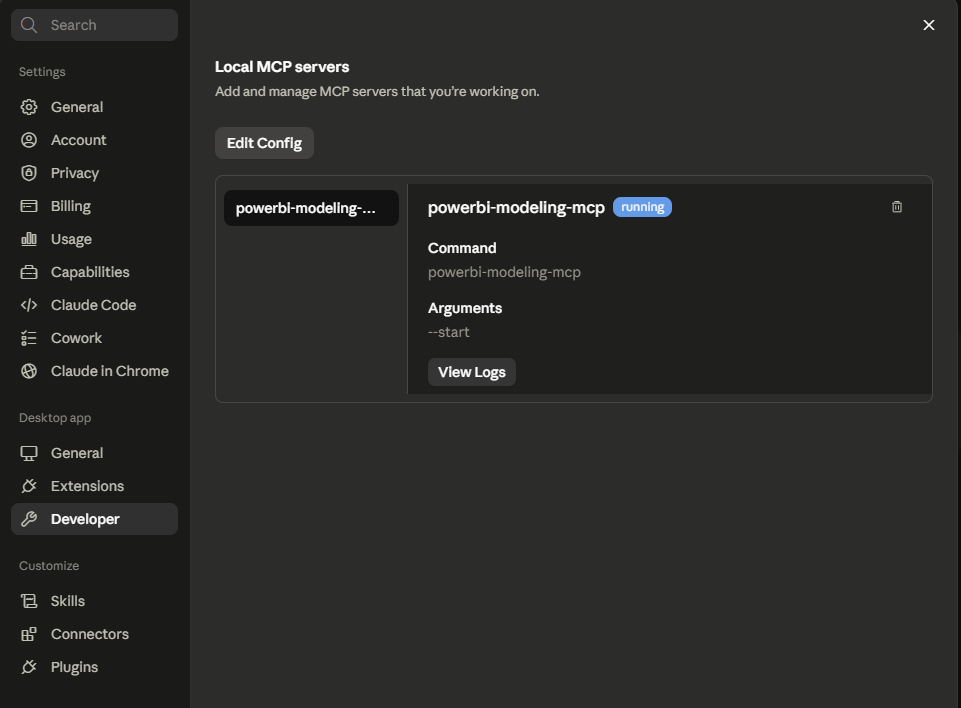
Check the tools loaded. You should see the server and its tools under the + menu at the bottom of the chat box within connectors. Anthropic’s local MCP guide has more if it doesn’t show up.
-
Connect to a model. Open your file in Power BI Desktop, then tell Claude:
Connect to 'file_name.pbix' in Power BI DesktopThe server finds the local Analysis Services instance Desktop spun up for that file and attaches to it.
-
Smoke test it. Ask Claude to list every measure in the model with its DAX. If that comes back right, you’re on a live model and everything below is fair game.
Heads up on one thing: the server asks for your OK before its first query and its first edit on each model. That’s deliberate. You’ll see the approval prompt pop up in the chat.
What it’s actually good at
The pattern that holds across all of this: Claude is great at the mechanical, high-volume model work, and at anything it can check by running a query. Business logic still needs your input. With that in mind, here’s where you can be replaced.
Documenting a model someone dumped on you
Documentation is the job nobody ever has time for. Point it at the model and ask for the works: every table and measure explained in plain language, DAX included, relationships drawn as a Mermaid diagram, data sources reverse-engineered from the Power Query. Then take it one step further and have it write those descriptions back into the model, so the next poor soul who opens it sees them in the tooltips.
Answering questions by writing and running the DAX
Ask something in plain English (“which ten customers drove the margin drop in March?”) and Claude writes the query, validates it, runs it against the model, and reads the answer back. Because it can run queries, it checks its own work. If a measure looks off, it’ll query the pieces underneath to find where the logic broke.
Bulk edits that would eat your afternoon
This is where it’s strongest. Renaming fifty measures to a consistent convention. Adding descriptions to every column. Generating translations for another language. Shoving measures into sensible display folders. These are exactly the jobs Desktop gives you no bulk tooling for.
Calculation groups and time intelligence
Ask for a calendar table with year, quarter, and month hierarchies plus the usual time intelligence measures, and it builds the table, relationships and all. Or hand it a model drowning in measure sprawl (Sales YTD, Sales PY, Sales YoY %, on and on for every base measure) and have it fold the pattern into a calculation group.
Working out why a query is slow
It can capture Analysis Services traces. Ask Claude to run a slow query with the cache cleared, and it reads the timings back and tells you whether the time went to the formula engine or the storage engine, then suggests a rewrite and benchmarks it against the original. It won’t replace a proper tuning session on a nasty model, but for the everyday “why does this visual take eight seconds” it gets you to the problem quick.
Can it build the visuals?
No, and this is the one real downside. The server works at the model layer, and the report canvas is a different layer it has no reach into. Three ways I get around it, in the order I actually use them:
- Let Claude do the model work and drop the visual in yourself. Honestly the model is 90% of the effort. Once the measure exists and returns the right number, dragging it onto a chart is thirty seconds.
- Edit the report as code. Save the report as a Power BI Project (PBIP) and the report definition becomes JSON files on disk, which an agent like Claude Code can edit directly. Different workflow with its own sharp edges. It’s worth its own article, which I’m writing.
- Chart outside Power BI for a one-off. Have Claude run the query and throw together a quick chart from the results right in the chat. Not a report, but often all an ad-hoc question needs.
When it goes wrong
Claude can’t find the model. Power BI Desktop has to be open with the file loaded before you ask Claude to connect, and the file name in your prompt has to match. Also, the connection dies when you restart Desktop, since Desktop hands its local Analysis Services instance a fresh port every session. Reopen the file, reconnect.
The tools never show up.
Almost always one of three things. You restarted the window but not the app (exit from the tray, relaunch). Your JSON has a typo, or Claude Desktop can’t find powerbi-modeling-mcp on the PATH, which happens if you installed it after Claude was already running, or if npm’s global folder isn’t on your PATH at all. Run powerbi-modeling-mcp --start in a fresh terminal to check; if that works but Claude still can’t see it, put the full path from npm root -g into command instead. The logs at %APPDATA%\Claude\logs will tell you which of the three you’re looking at.
It seems to hang on the first edit.
Probably not hung. It’s waiting on your approval before the first query and first edit per model. Look for the prompt in the chat. If you really want it gone, --skipconfirmation in the args removes it, but only once you trust the workflow and have a backup.
Changes vanished when I closed Desktop. Edits over MCP land in the running Desktop session live, no refresh needed, but they’re not on disk until you hit save in Desktop. Treat it like any external tool: review, then save on purpose.
Fabric workspace won’t connect. Check three things in order: you’ve actually got write permission on the model, the workspace is on a capacity with the XMLA endpoint set to read-write, and the sign-in window didn’t open hidden behind your other windows. For unattended runs the server takes service principal auth through environment variables instead.
Is it safe to point at a client’s model?
Mostly, as long as you go in with your eyes open. It runs locally on your own credentials, so it can’t see anything you can’t already see. Schema, metadata, and query results travel through the chat to the model provider, same as if you’d pasted them in yourself.
So the rules I stick to on client work: keep a backup, or better, work on a copy. Don’t run data-returning queries against a model whose row contents you wouldn’t paste into a chat without asking first.
How’s this different from Copilot in Power BI?
Different layers. Copilot lives inside the Power BI product: it summarizes reports, answers questions in the service, makes visuals, and it’s tied to Microsoft’s capacity licensing. The MCP route brings your own model (Claude here) down to the semantic layer, where it’s far stronger at DAX, refactoring, and bulk work, and has no interest in the canvas.
FAQ
Does it work with models published to the Power BI Service? Yes. Connect to the model in its Fabric workspace and the server works on the published model directly, using your permissions.
Do I need Premium? Not for the Desktop route, free Power BI Desktop is enough. For published models you need a capacity that exposes the XMLA endpoint: Fabric F SKU, Premium, or Premium Per User.
Can Claude see my actual data? Yes, when it runs queries. Results come back through the chat, so treat query output the way you’d treat anything you paste into a chat.
Can it break my model? It can write to it, so in principle yes. The built-in confirmation prompts and a backup before any bulk job cover the realistic risks.
Does it work on a Mac? Partly. The server ships macOS and Linux builds alongside Windows, so it runs fine. Power BI Desktop doesn’t exist on macOS though, so the Desktop connection route is out. Connect to a Fabric workspace model or work against PBIP files instead, or run Desktop in a Windows VM.
The Future
The Modeling MCP server is still public preview and getting visibly better between versions. My prediction: within a year, editing a model by hand for anything mechanical will feel like formatting a document one cell at a time. The report layer is the missing piece, and the PBIP route is already an alternative at how that gets solved.
If you’re doing this for a client or internal team and want a second pair of hands, it’s the kind of work I do. Get in touch.

Enjoyed this? Let’s talk shop.
I’m always up for trading notes, or helping on a project like this one.